Add Your First Client
Enter birth data once and pick the exact birth city, so every chart is accurate from the first field.
A client is the centre of everything in ChartVault: their birth data drives every chart, their session history lives on one card, and their chart against the real sky drives your outreach. You enter the birth data once.
Create the client
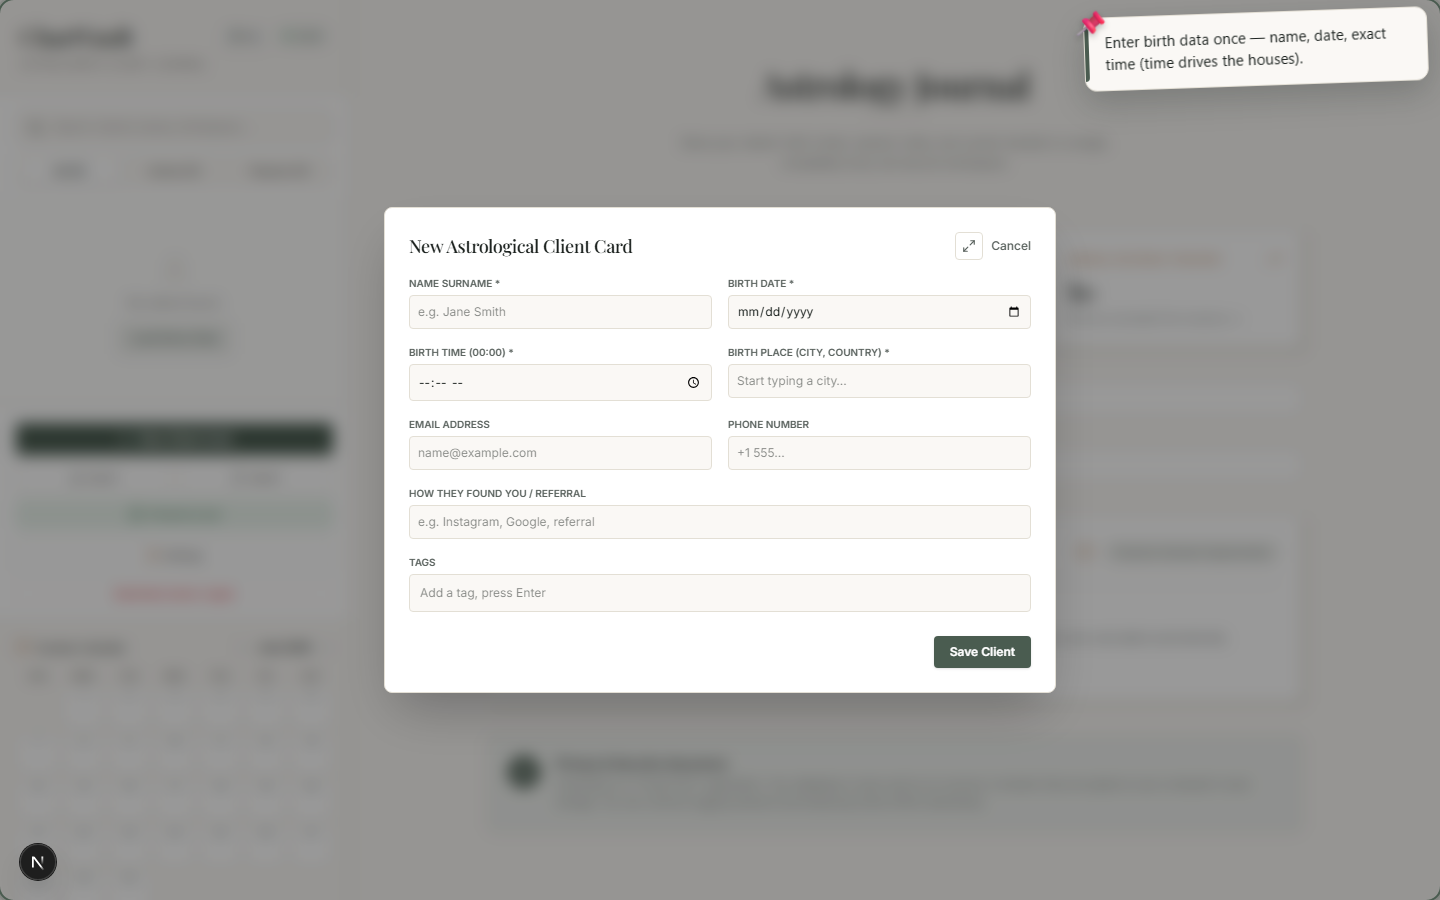
- Click + New Client Card. A blank client form opens.
- Enter the name, birth date, and exact birth time.
The birth time matters
The time of birth drives the houses and the Ascendant. A chart is only as accurate as its birth time — enter it as precisely as you have it.
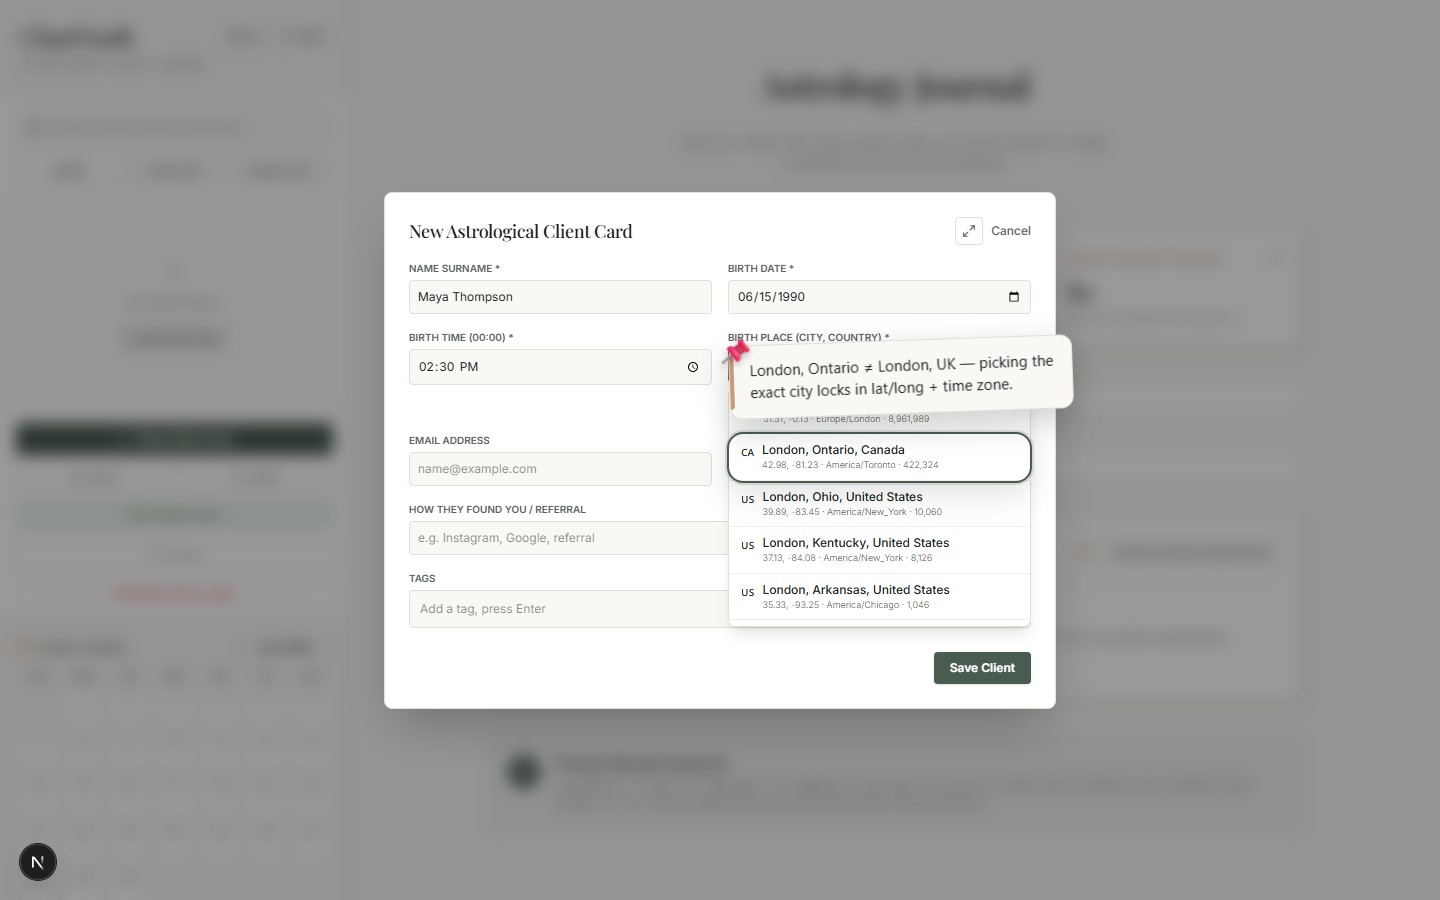
Pick the exact birth city
This is the step that makes every later chart correct. As you type a city, ChartVault shows a list of real places — each with its region, country and time zone.
- Start typing the city (e.g.
London). - Choose the exact match from the list — London, Ontario, Canada is a different place from London, England.
Picking from the list locks in the precise latitude, longitude and time zone, so the houses, Ascendant and angles are computed against the right coordinates — no manual lat/long entry, and no third-party chart site.
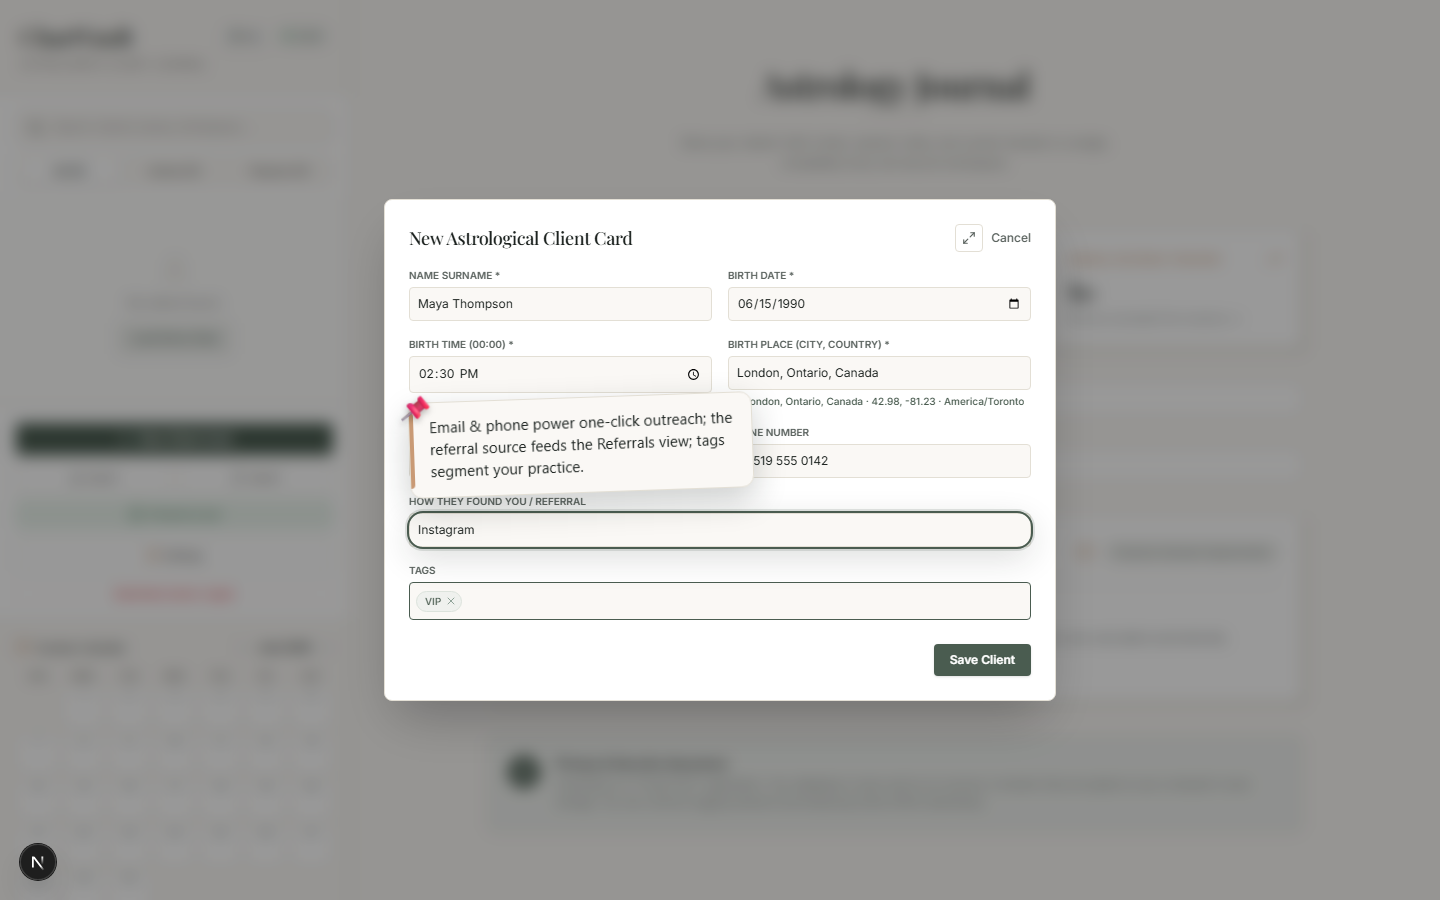
Add contact and segmentation details
The same form captures the fields that power the rest of ChartVault:
- Email and phone — used for one-click email and WhatsApp outreach.
- Referral source — feeds the Referrals growth view.
- Tags — free-form labels (VIP, Student, Couples work) that segment your practice and power the sidebar filter.
Click Save and the client appears in the sidebar. ChartVault immediately starts watching this client's sky for outreach opportunities.
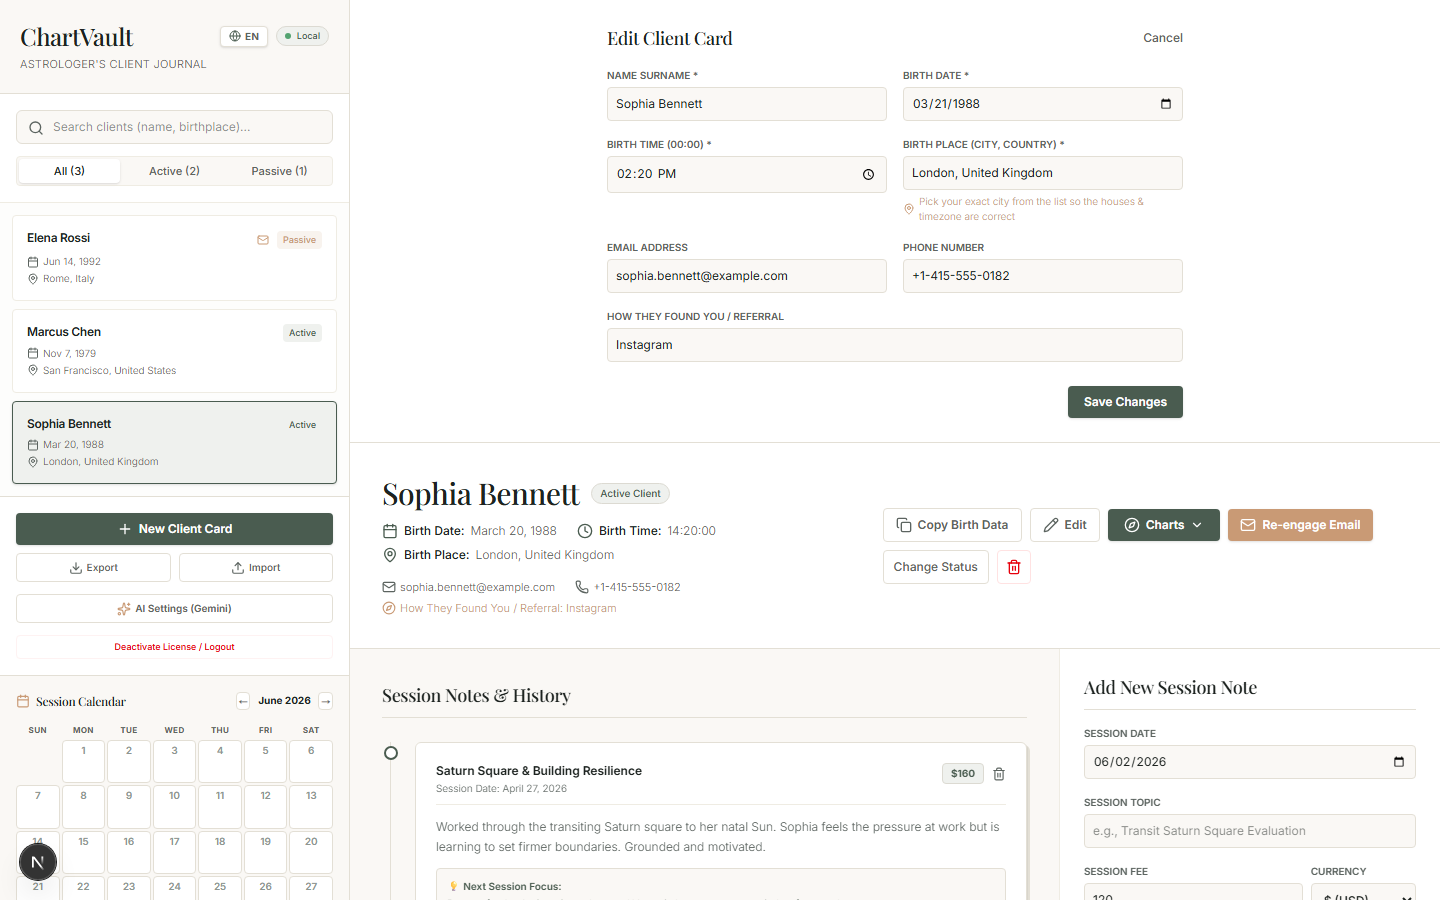
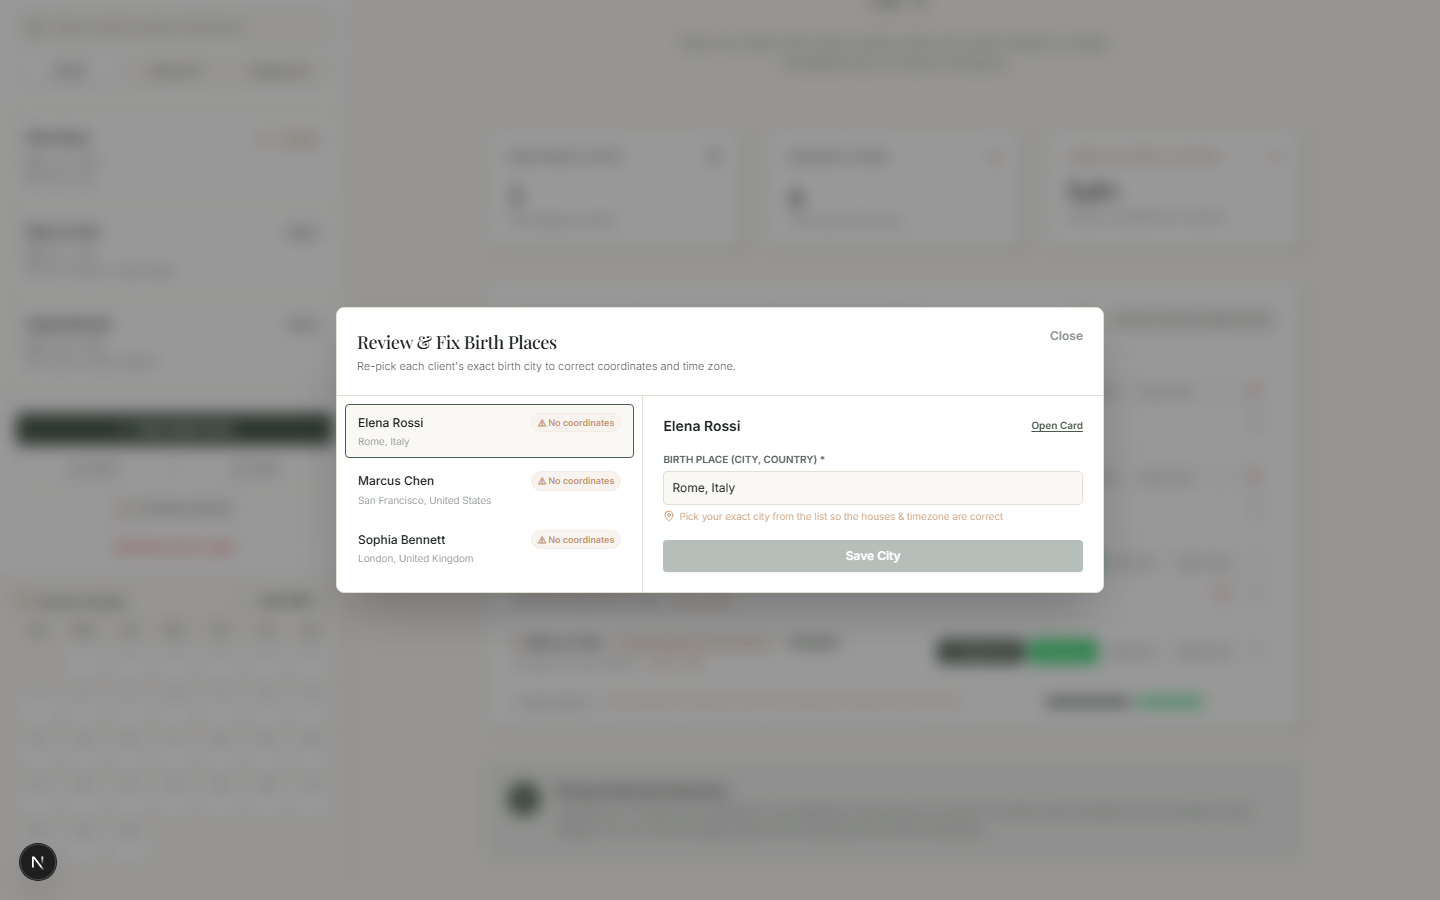
Fixing an older client's city later
If a client was added earlier with a free-typed city (no coordinates), open their card and click Edit, then re-pick the city from the list. ChartVault updates the stored coordinates and time zone in one click, and every chart for that client is correct from then on.
What's next
With a client saved, the dashboard comes alive. Learn your way around it in The dashboard at a glance, then dive into the daily workflow in The Core Loop or start casting charts in The Chart Engine.