The Dashboard at a Glance
Find your way around ChartVault — the sidebar, the stat cards, and the opportunity feed.
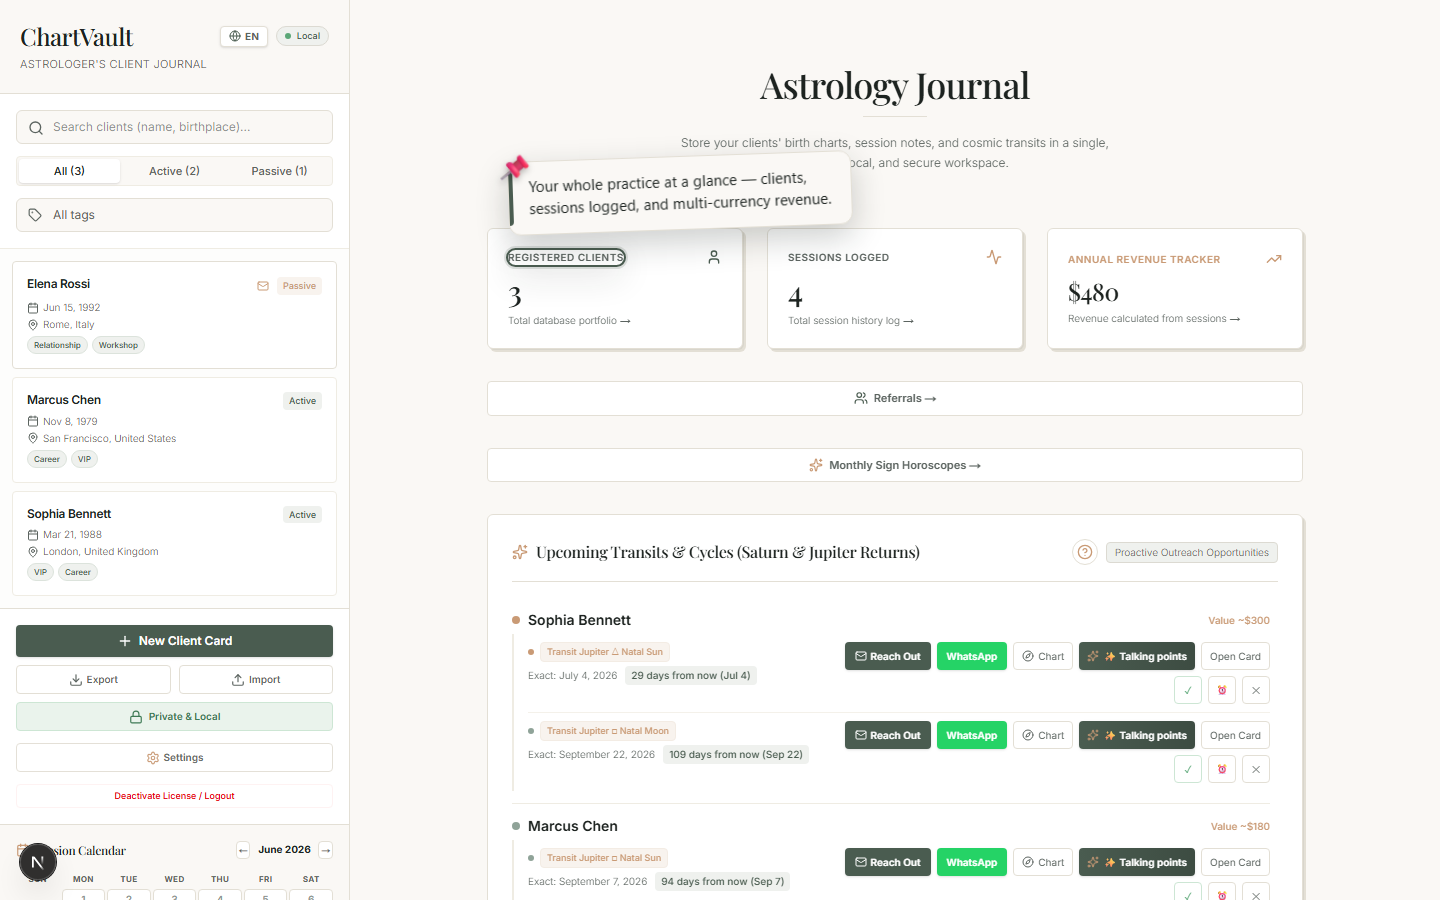
The dashboard is your home screen. It shows your whole practice at a glance and is the launch point for everything else.
The three regions
Sidebar — your clients
The left sidebar lists every client. From here you can search, filter by tag, open a client card, and reach the app-wide controls (language, the Private & Local badge, settings). Each client row shows its tags as chips.
Stat cards — the numbers, and they drill down
Across the top sit the headline figures:
- Registered Clients
- Sessions Logged
- Annual Revenue — aggregated per currency across 18 world currencies, each totalled on its own.
Every stat card is clickable. Clients and Sessions open a spreadsheet-style data explorer; Annual Revenue opens Revenue Analytics. The dashboard isn't a dead summary — it's the entry point to the detail.
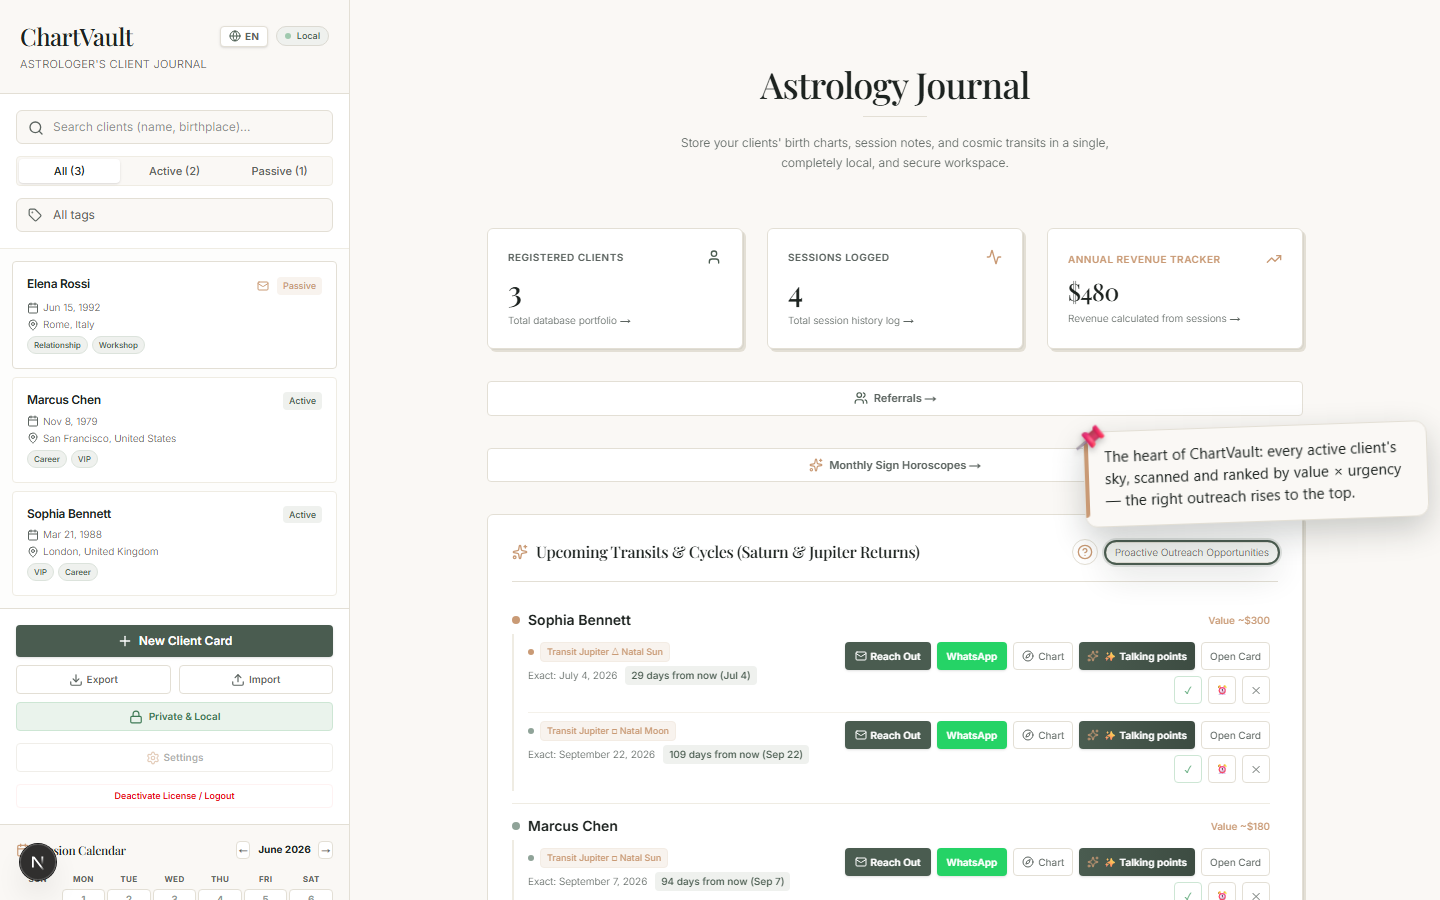
The opportunity feed — who to contact, right now
The heart of ChartVault. It scans every active client's chart against the real sky and presents one list, ranked by value × urgency, of who to reach and why. This is the daily driver covered in The Core Loop.
Loading the demo data
To explore ChartVault with a populated practice before you've entered much yourself, use Load Demo Data. It adds a set of fictional clients with real birth data and session history, so the charts, feed and analytics all have something to show. The demo clients are clearly fictional and can be removed at any time.
Where to go next
- Daily money loop: The Core Loop — the feed and one-click outreach.
- The craft: The Chart Engine — every chart type and analysis panel.
- Operations: Running Your Practice — sessions, packages, receipts, calendar.